
How to Look Up Kitsap County Jail Population Data
The most accessible source for a real-time snapshot of Kitsap County jail population is the Sheriff's Web Jail Viewer at incustody.kitsap.gov. A wildcard search using the percent sign in the last-name field returns all people currently in custody. Results are paginated, and on a typical day the roster runs across more than twenty pages. The viewer does not display a single headline population count, so the closest you can get to a live number is the total count shown at the top of the results list.
For official aggregate population figures, the Kitsap County Sheriff's Office publishes annual reports that include average daily population data, booking counts, and corrections-division program summaries. Those reports are posted on the Sheriff's Office website at kitsap.gov/sheriff. The county budget book is a second official source; it contains a Corrections Division section that lists planned and actual population figures alongside staffing and cost data. Both documents update annually rather than in real time, so they reflect the prior calendar or fiscal year. Neither the roster nor the reports provide a live dashboard with demographic tabs or a population breakdown by legal status, which is the kind of data you find at the federal level through the Bureau of Justice Statistics.
The BJS Annual Survey of Jails and the Vera Institute's Incarceration Trends tool are the two main sources for county-level trend data drawn from a standardized methodology. Vera's data is at trends.vera.org and lets users pull county-specific population estimates for Washington jails back to the 1970s, adjusted to a per-100,000-residents rate for comparison.
The screenshot below comes from the Bureau of Justice Statistics website, which publishes the national jail surveys that underpin county-level context.
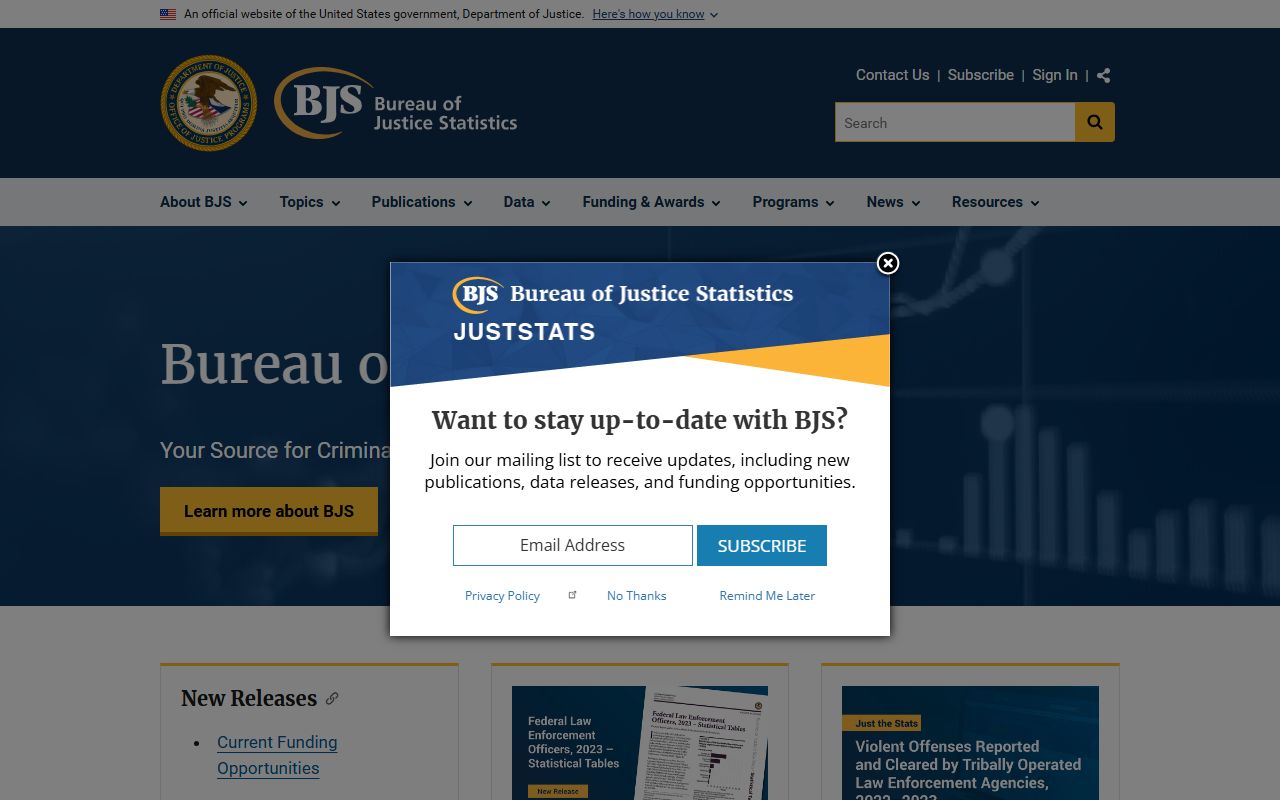
BJS publishes the Annual Survey of Jails and the Census of Jails, which are the two core datasets used to place county figures in state and national perspective.
Kitsap County Jail Capacity Overview
The Kitsap County Sheriff's Office Jail is the only county-operated detention facility. It sits at 614 Division Street, MS-33, in Port Orchard, the county seat. The jail holds people awaiting trial in Kitsap Superior Court and District Court, people serving short sentences, and people held on out-of-county warrants or federal detainer requests. The physical rated capacity of the facility is a data gap. The official capacity number was not confirmed in the publicly available pages harvested for this project; the annual reports that carry that figure were inaccessible during the research pass. The table below notes this honestly.
| Facility | Address | Rated Capacity | Notes |
|---|---|---|---|
| Kitsap County Sheriff's Office Jail | 614 Division Street, MS-33, Port Orchard, WA 98366 | Not confirmed (research gap) | Live population visible via Web Jail Viewer; official capacity reported in annual reports not yet retrieved. |
Kitsap also uses a work release program, which reduces the number of people who need a full jail bed. People in work release live in the work release building adjacent to the jail entrance on Cline Street. Work release participants are counted differently from general-population inmates, and that distinction matters when comparing year-to-year totals across county reports. If you need the current rated capacity for a research project or legal filing, call the Kitsap County Sheriff's Office directly at the jail administration line.
The screenshot below shows the Sheriff's Office homepage, which links the live jail viewer and the annual reports that contain population and capacity context.
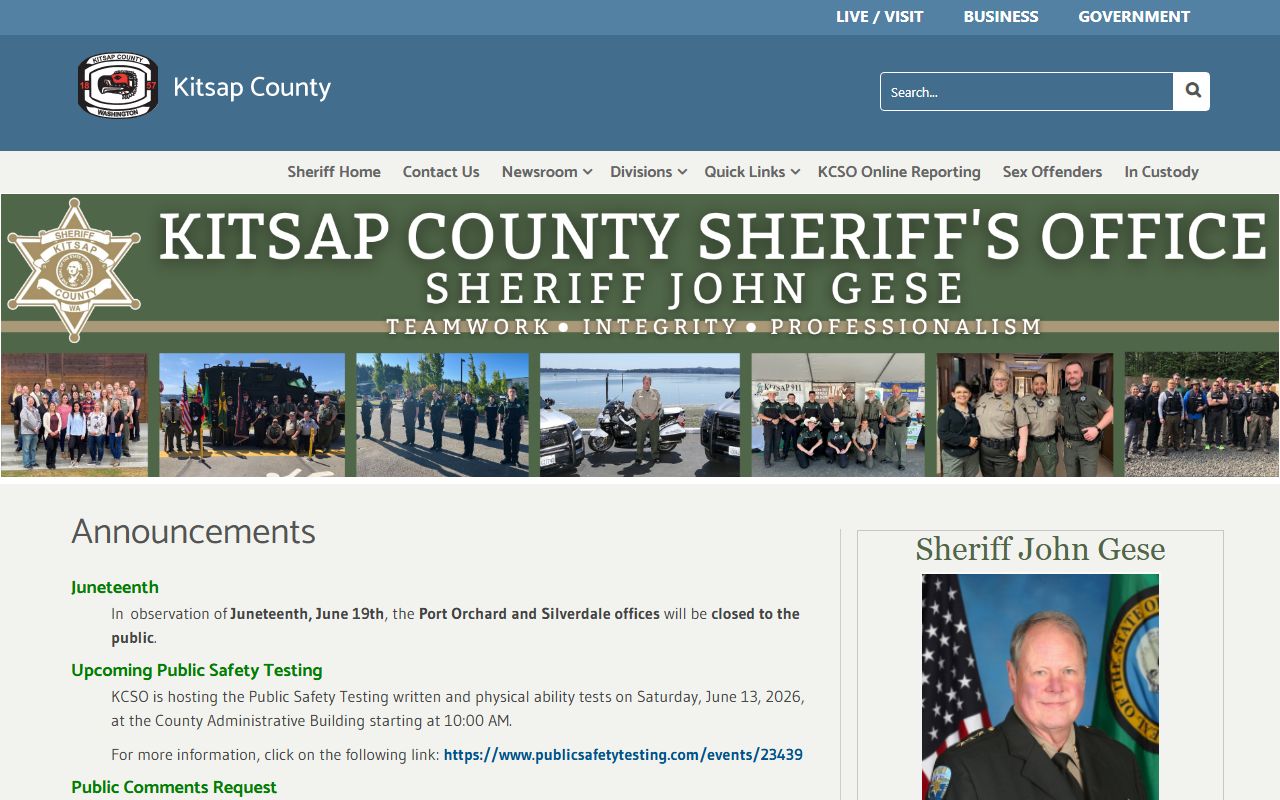
From the Sheriff's homepage you can reach the Web Jail Viewer, the annual report archive, and the visitation and mail information pages that families and researchers use most often.
Average Daily Population in Kitsap County Jail
Average daily population, or ADP, is the standard metric for jail size. It counts the mean number of people held on any given day across a reporting period, usually a calendar year. A single-day headcount can spike or dip based on weekend booking patterns, court dates, and seasonal factors, so ADP smooths those variations into a more stable number for budget planning and trend analysis.
Snippets from the Kitsap County Sheriff's 2023 Annual Report and from the county budget book reference a range of approximate ADP figures across recent years. The annual report snippet listed figures of approximately 415, 370, 260, 262, and 313 across a multi-year span, while the budget document referenced figures including approximately 275, 314, 262, 250, 425, and 420. The year-by-year labels for those figures were not confirmed during the research phase because the full PDF files returned errors when accessed directly. Any attempt to assign a specific year to a specific number from those snippets would be speculation.
What the numbers do show, taken together, is a pattern consistent with national trends: a population that was in the upper 300s to low 400s before 2020, a sharp drop to the low 260s during the COVID-era period when court processing slowed and booking policies changed, and a partial rebound into the 300s in later reporting years. That arc matches what BJS documented nationally for local jails and what Vera's county-level data shows across Washington. The year-specific figures should be confirmed against the official annual report PDF before being cited in any formal document.
Note: Vera Institute data for Washington counties may use BJS survey estimates for years between full censuses; confirm the methodology tab on the Vera tool when pulling trend numbers.
Demographic Breakdown of Kitsap County Jail Population
The Kitsap Web Jail Viewer collects demographic fields on every person booked into custody. Those fields appear in individual booking records and in the roster results list. However, the live roster does not aggregate those fields into a published demographic dashboard, and the annual reports harvested during research did not include a fully extracted demographic table. The table below describes the fields the roster carries, which tells you what data the Sheriff collects and what a researcher could theoretically compile from the roster, even if the county does not publish a ready-made breakdown.
| Roster Field | What It Shows |
|---|---|
| Race | Race category as recorded at booking by the arresting agency. |
| Sex | Sex as recorded at booking. |
| Age / Date of Birth | Age or date of birth visible in the individual booking profile. |
| Booking Date | Date and time the person was booked into the facility. |
| Scheduled Release Date | The projected release date entered by jail staff; may change. |
| Charges | The charge or charges entered by the arresting agency at booking. |
| Bond / Bail | Bond amount or type, if one has been set. |
| Arrest Agency | The law enforcement agency that made the arrest. |
Because Kitsap does not publish a demographic summary report on a public-facing page, people doing demographic analysis typically request data through the county's public records process under chapter 42.56 RCW, or they use BJS published tables for Washington-level demographic comparisons. The BJS Annual Survey of Jails does collect race, sex, and legal-status breakdowns at the national and state level, and those figures provide the closest available benchmark for understanding how Kitsap's population might compare to state and national patterns.
Pretrial vs. Sentenced Population in Kitsap Jail
Jails hold two broad groups: people who have not yet been tried or resolved their case (pretrial), and people who are serving a sentence after a conviction (sentenced). This split matters because it reflects how much of the jail population is there by court order related to an ongoing case versus how many are completing a punishment. Nationally, pretrial detention has grown as a share of total jail population over the past two decades. BJS data shows that roughly two-thirds of people in local jails on any given day in recent years are held pretrial.
The Kitsap County Jail roster does not publish a pretrial or sentenced status field in the pages reviewed. The charge fields visible in the roster show what a person is held on, but they do not directly indicate whether that person has been convicted or is awaiting resolution. A booking record might list a charge under "Kitsap Superior Court" or reference a court type code, but the county does not translate those codes into a public pretrial/sentenced dashboard.
| Status | Kitsap Data Available | National Benchmark (BJS) |
|---|---|---|
| Pretrial (unconvicted) | Not published in live roster; available by public records request | Approximately 66-68% of local jail population nationally (BJS Annual Survey of Jails) |
| Sentenced | Not published in live roster; available by public records request | Approximately 32-34% of local jail population nationally (BJS Annual Survey of Jails) |
Kitsap's specific pretrial percentage would require pulling data from the annual report or submitting a public records request to the Sheriff. Given that Kitsap is a mid-size Pacific Northwest county with active Superior and District Court dockets, its split is not expected to deviate sharply from the national pattern, but that inference is not a substitute for the official figure.
Misdemeanor vs. Felony Population in Kitsap County Jail
Both misdemeanor and felony defendants can be held in the Kitsap County Jail. Felony cases are filed in Kitsap Superior Court. Misdemeanor and gross misdemeanor cases are filed in District Court or in one of the city municipal courts serving Bremerton, Bainbridge Island, Poulsbo, or Port Orchard. People in all those tracks may be booked into the county jail if the court orders detention or if bail is not posted.
The charge-type breakdown for the Kitsap jail population is not published on a public-facing page. The roster lists individual charges, but an aggregate count split by charge level requires a data request. National BJS data shows that felony charges account for the majority of pretrial detention days in most local jails, in part because felony bail amounts tend to be higher and case resolution takes longer. Misdemeanor defendants are more likely to be released quickly on personal recognizance or low bail, which keeps their share of any single-day count lower than their share of total bookings over time.
For Kitsap County arrest records that cover the underlying charges connected to a booking, the criminal records page describes how charge information flows from booking through the court file.
Mental Health and Medical Population
Mental health and medical care inside the Kitsap County Jail is a function of the Corrections Division, which operates the facility. The Kitsap County Sheriff's annual report references behavioral health programming and coordination with the court system, including the District Court Behavioral Health Court, which diverts eligible defendants with mental illness or co-occurring disorders into treatment rather than incarceration. Participation in that program reduces the number of people with high behavioral health needs who cycle through the jail repeatedly.
A specific percentage of the Kitsap jail population receiving mental health or medical services is not published in a public-facing summary. This type of data is common in large urban jail systems that publish detailed annual reports with clinical breakdowns, but smaller county systems rarely break it out on a public page. The Vera Institute and BJS both document that mental illness is disproportionately represented in local jail populations nationally, with some surveys finding that 15 to 20 percent of people in custody have a serious mental illness. Kitsap's Behavioral Health Court and its coordination with the Sheriff suggest the county is aware of this dynamic, but precise local counts are not part of the publicly harvested data for this project.
Researchers who need those figures can submit a public records request to the Kitsap County Sheriff under chapter 42.56 RCW, Washington's Public Records Act, which applies to Sheriff's Office administrative records. The Sheriff's Office typically responds within five business days with a record, a denial with legal basis, or an estimated timeline for producing a large dataset.
National and State Context for Kitsap Jail Population
The Bureau of Justice Statistics is the official federal source for jail population surveys. Its Annual Survey of Jails collects data from local jails across the country each year, and its Census of Jails (conducted less frequently) provides a full count. The Vera Institute's Incarceration Trends tool builds on BJS data to produce county-level estimates, including rates per 100,000 residents, which allow fair comparisons across counties of different sizes.
Washington State's average jail incarceration rate sits below the national average. BJS data consistently shows national local jail rates in the range of 200 to 230 per 100,000 residents in recent years, while Washington's rate runs lower, in part because Washington has strong diversion programs, a public defense system that handles a high volume of early releases, and specialty courts like Kitsap's Behavioral Health Court that route people away from detention. These are state-level and national observations drawn from BJS and Vera; they are not Kitsap-specific operational counts.
| Level | Approximate Jail Rate per 100,000 | Source |
|---|---|---|
| Kitsap County | Not confirmed (see ADP section above; population approx. 270,000-285,000) | Vera Incarceration Trends / BJS ASJ (verify at trends.vera.org) |
| Washington State (average) | Below national average; approximately 120-160 per 100,000 in recent BJS estimates | BJS Annual Survey of Jails |
| National (U.S. average) | Approximately 200-230 per 100,000 in recent years | BJS Annual Survey of Jails |
All figures in the table above are drawn from published BJS and Vera materials and are labeled as context, not as current Kitsap operational data. The Kitsap-specific rate would require dividing the confirmed ADP by the current county population, which changes with each census estimate. Use the Vera tool for the most current county estimate and check the methodology note on that site for how post-2019 values are calculated.
Kitsap County Jail Population Trends Over Time
The broad multi-year arc for Kitsap jail population follows a pattern seen in most mid-size county jails across the country. Before the COVID-19 period, Kitsap's ADP figures appear to have been in the upper 300s to low 400s based on snippets from the annual report and budget documents. That range is consistent with a county that had a growing population and active criminal dockets in Kitsap Superior Court and the District Court.
During 2020 and the period immediately following, ADP figures dropped sharply. Snippets from official documents reference figures as low as 260 to 262 in the COVID-era period. This drop was not unique to Kitsap. The Vera Institute documented that local jail populations fell by roughly 30 percent nationally between 2019 and mid-2020, driven by emergency releases, reduced bookings, delayed court proceedings, and changes in arrest policy during the pandemic. Some of those reductions were temporary. Others reflected more lasting shifts in how courts handled low-level cases.
Later snippets from Kitsap's documents suggest the ADP began returning to the low-to-mid 300s in years after the initial drop. This partial rebound also matches national data from BJS, which shows most county jail populations recovering toward but not always reaching their pre-2020 levels. The exact year-by-year table for Kitsap requires the full annual report PDFs, which were not accessible during this research phase.
- Pre-2020 era: ADP figures approximately in the upper 300s to low 400s (unconfirmed year labels)
- COVID-era trough: ADP figures approximately 260-262 (unconfirmed exact year)
- Post-2020 recovery: ADP figures approximately in the low-to-mid 300s (unconfirmed exact year)
- Source: Kitsap Sheriff annual report and budget document snippets, labeled as approximate and unconfirmed
- National context: BJS documents a similar arc for local jails across the U.S., with a 2020 drop and partial rebound
People who need confirmed year-by-year figures should download the current annual report directly from the Sheriff's Office website or use the Vera Incarceration Trends tool, which provides estimated county-level ADP and rate data with sourcing notes.
The screenshot below shows the Kitsap County Web Jail Viewer, the live roster tool that gives the most current count of people in custody.
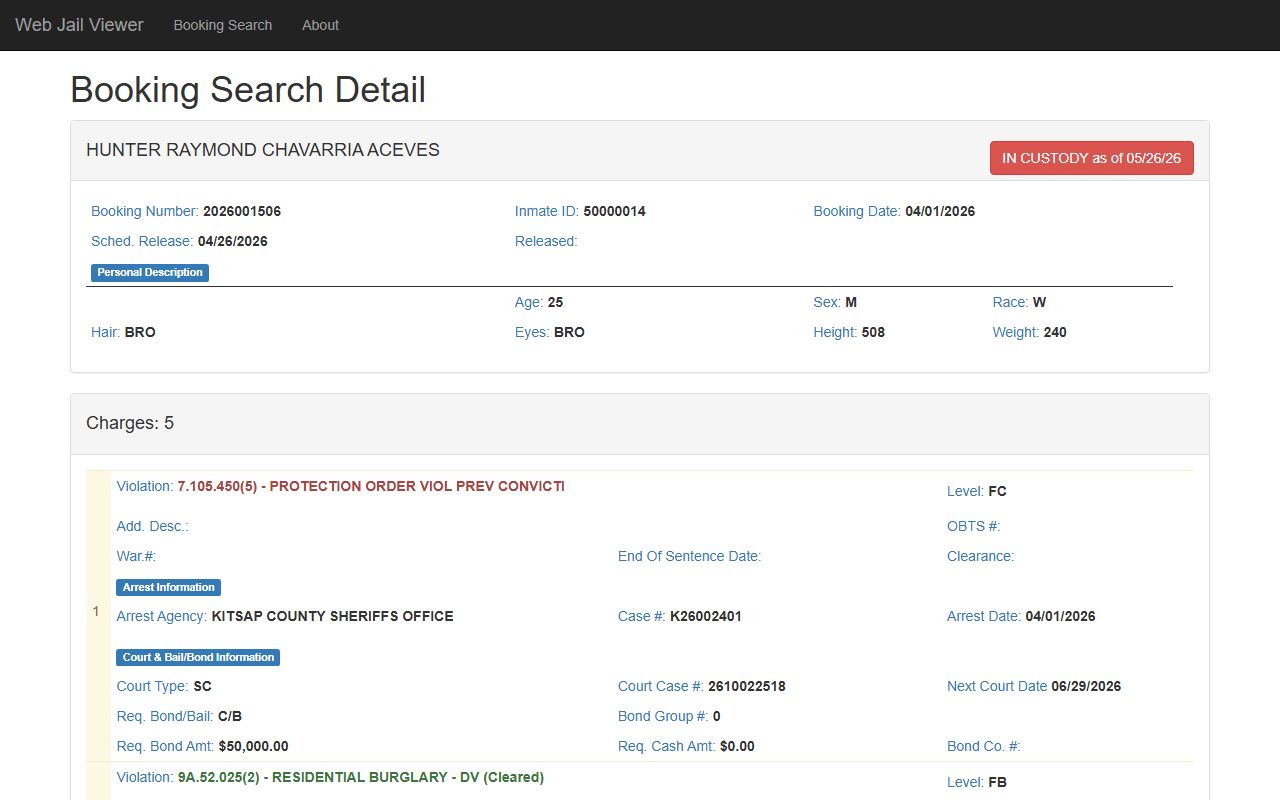
The viewer's total-results count at the top of the paginated list is the closest available real-time figure for the current Kitsap jail population, though it is a roster count rather than a formal ADP calculation.
Searching for Kitsap County Inmate Records by Name
The data on this page covers aggregate jail population figures, capacity context, and demographic field descriptions rather than individual inmate lookups. If you need to find a specific person currently in custody, search by name, booking number, or date range through the Kitsap County inmate records page, which covers the Web Jail Viewer search fields, how to read a booking profile, and what the charge and status codes mean. For people who have already been released, the Kitsap County released inmates page covers the VINELink notification system, state DOC records, and other post-release lookup tools.
Where the Kitsap Jail Population Data Comes From
Population data for the Kitsap County Jail flows from several distinct sources, each with a different scope and update cadence. Understanding which source you are using tells you how current and how complete the number is.
The live Web Jail Viewer at incustody.kitsap.gov is updated by jail staff as bookings and releases are processed. It reflects the current in-custody population in near-real time, but the Sheriff notes that data quality depends on what the arresting agency entered at booking and that the viewer should be confirmed by phone for anything urgent. It is operational data, not an audited count.
The Kitsap County Sheriff's annual report is the official retrospective source. It is produced after the close of the reporting year and typically includes ADP, total bookings, a program summary, and staffing data for the Corrections Division. The report is the document most often cited in academic and policy work about Kitsap jail trends. Annual reports are posted on the Sheriff's site at kitsap.gov/sheriff.
The county budget book is a supplementary official source. The Corrections Division section of the budget includes planned and actual population figures used for staffing and cost projections. Those numbers are sometimes the first official figure available for a given year before the full annual report is published.
The Bureau of Justice Statistics at bjs.ojp.gov is the federal source for standardized jail survey data. BJS collects data from jails nationwide through the Annual Survey of Jails and the Census of Jails. Counties with under 50 average daily population are sometimes excluded from the annual survey, but Kitsap is well above that threshold. BJS publishes national and state summary tables, and individual county data appears in the Vera Incarceration Trends tool, which draws on BJS datasets plus supplemental sources to fill gaps between census years.
For Kitsap County criminal records that sit behind a jail booking, the criminal records page covers how charges filed by the arresting agency connect to the court case that follows arraignment.